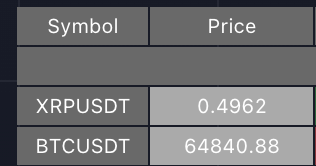
Price
The most recent trading price of the instrument.
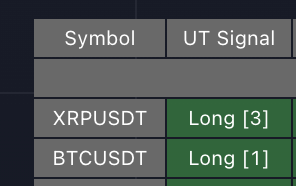
UT Signal
The most recent signal generated by the UT Bot. Bright color with short/long text means the UT Bot signal is active for the live bar. The number in square brackets indicates the last signal was X bars ago.
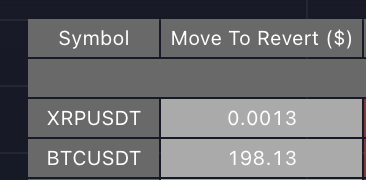
Move to Revert
The price movement required for the current bar could trigger a change in the UT Bot signal. You can change the format of this move to $, ATR, or %.
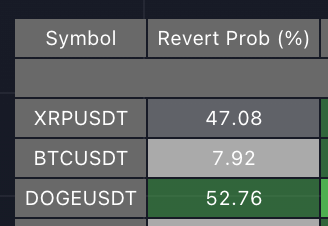
Revert Probability
An estimated probability is that the UT Bot signal will revert within the current bar. It takes the remaining of the bar in milliseconds and estimates the needed move based on the recent volatility.
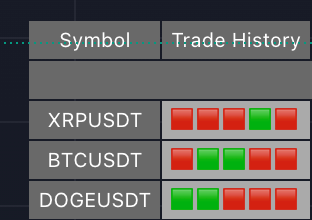
Trade History
The outcomes of the last five trades are displayed as squares, with green indicating a profit and red indicating a loss. It’s an easy way to estimate how profitable the recent UT Bot trades were.
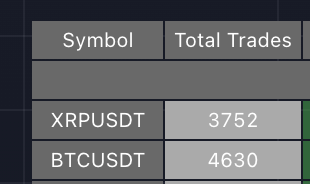
Total Trades
The total number of trades executed using the UT Bot strategy throughout history.
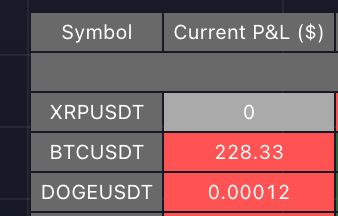
Current P&L
The profit or loss for the currently open trade. You can change the format of this pnl to $, ATR, or %.
The following columns replicate the backtesting results in TradingView when running generic Pine Script strategies.
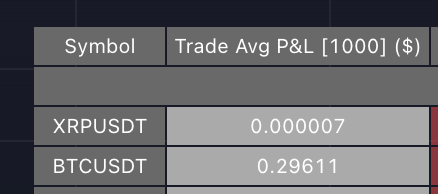
Trade Avg P&L
The average profit or loss for the last X trades. You can change the format of this pnl to $, ATR, or %. The number in the title of the columns means how many trades we used for calculations. It can be changed from parameters.
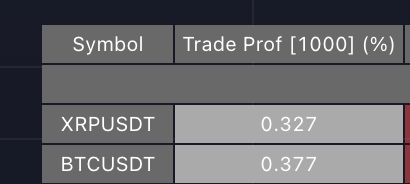
Trade Prof
The percentage of profitable trades from the last X trades.
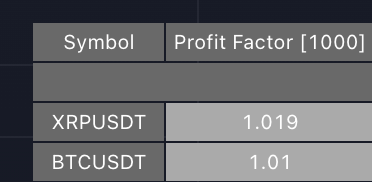
Profit Factor
The profit factor for the last X trades is calculated as the ratio of gross profit to gross loss.
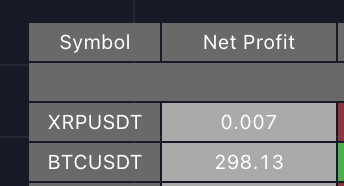
Net Profit
The total net profit generated from the last X trades. You can change the format of the Net Profit to $, ATR, or %.
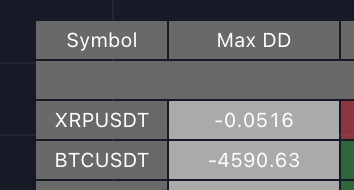
Max DD
The maximum drawdown experienced over the last X trades. It’s computed on trade granularity.
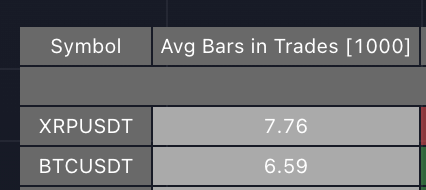
Avg. Bars in Trades
The average duration of trades, measured in bars, for the last X trades.
